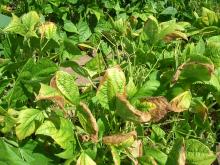
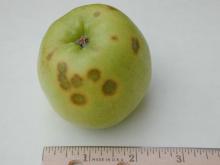
The only way to accurately diagnose a nutritional problem of plants is to conduct a soil test and tissue analysis at the same time. This identifies which nutrients are deficient (or excessive) in the plant, while determining what factors in the soil may have caused the nutrient imbalance. Visually diagnosing nutrient deficiencies is often inaccurate. Despite the myriad of nutrient deficiency keys found in books and on the Internet, many of the “classic symptoms” of nutrient deficiency look alike. A deficiency symptom can occur because the nutrient is deficient in the soil or because another nutrient is in excess and out-competing the nutrient in question.
An understanding of how plants work and how mineral nutrients behave in the plant will aid your diagnosis of plant nutritional problems. Determining the nutritional status of container crops will also be discussed.
Plant Food
Plants are comprised of roughly 90% water and 10% dry matter but this ratio varies from herbaceous to woody plants. The 10% dry matter consists of 16 elements (Table 1). Plant nutrition should focus on providing the plant the proper environment and fertilizer amendments to achieve the appropriate balance of each element.
Contrary to what many fertilizer packages state, fertilizers are not plant food. Plants generate their own food through photosynthesis, in which plants combine carbon, hydrogen, and oxygen by utilizing sunlight as an energy source to form carbohydrates. Plants obtain carbon and oxygen from carbon dioxide (CO2) in the atmosphere. Plants derive hydrogen and oxygen from water absorbed, primarily through plant roots. Most plants form either starch or sugar for storing energy.
Plants shuttle sucrose (and other carbohydrates) throughout the plant via phloem. Once the sucrose reaches its destination, it can be either stored or converted to energy through metabolic processes. Sugars and starch generated from photosynthesis are plant food. Fertilizers, on the other hand, are mineral nutrients required by the plant for construction and correct functioning of all the biochemical machinery used in photosynthesis as well as cell wall construction, phloem loading, cell division, and other plant biochemical processes. In a gross oversimplification, think of plants as machines that generate their own energy (via photosynthesis), while the mineral nutrients are substances required to coordinate the machinery and keep it running.
Carbon, hydrogen, and oxygen make up roughly 89% of plant dry matter. In greenhouse production carbon can limit plant growth, but in outside crop production it is generally not a factor. Lack of water will cause a host of problems in plants (wilting and death among the most obvious) long before a nutrient deficiency is realized. Thus there are 13 mineral nutrients that are most important when considering plant nutrition.
Mineral Nutrients
Plants require several mineral nutrients (Table 1). Six of the mineral nutrients are needed in relatively large quantity and are called macronutrients, while the other seven are needed in relatively small quantity and are called micronutrients. Examine Table 1 which shows the % dry matter of each nutrient within the plant. Also examine the quantity of each nutrient required in the soil. Some nutrients are required by the plant in greater quantity, and thus need to be present in the soil in greater quantity.
Consider the construction of a barrel and the quantity of water it can hold (Whitcomb, 2001). Imagine that each stave (vertical wooden slat) of the barrel represents one of the 14 mineral nutrients. The concentration of each mineral is represented by the length of its stave, with optimum concentration represented by a stave just long enough for a full barrel. If one of the staves is too short (deficient nutrient) the amount of water that can be held by the barrel is reduced (plant growth is reduced). If one of the staves is too long (nutrient in excess quantity), the barrel can hold no additional water; in fact, some nutrients in excess will cause a deficiency in others. Just as the volume of water the barrel will hold is maximized by each stave being the correct length, plant growth is optimized by each nutrient being in correct concentration in the soil.
|
Table 1. List of essential elements for plant growth, the % composition in plant dry weight, and sufficient soil levels for each. |
||
|
Element |
% of plant dry matterz |
Concentration in soily |
|
Carbon (C) |
89% combined for C, H, and O |
|
|
Hydrogen (H) |
||
|
Oxygen (O) |
||
|
Macronutrients |
||
|
Nitrogen (N) |
4.0% |
(nitrate) 10-30 ppm |
|
Phosphorus (P) |
0.5% |
20-40 ppm |
|
Potassium (K) |
1.5% |
150-700 ppm |
|
Calcium (Ca) |
1.5% |
1000-2000 ppm |
|
Magnesium (Mg) |
0.5% |
60-180 ppm |
|
Sulfur (S) |
0.25% |
2-10 ppm |
|
Micronutrients |
||
|
Iron (Fe) |
0.01% |
|
|
Manganese (Mn) |
0.03% |
>1.5 ppm |
|
Zinc (Zn) |
0.003% |
>1 ppm |
|
Molybdenum (Mo) |
0.0003% |
|
|
Chloride (Cl) |
0.1% |
|
|
Copper (Cu) |
0.015% |
>0.6 ppm |
|
Boron (B) |
0.005% |
0.5-2 ppm |
|
z Values vary with crop. yValues vary with crop and laboratory extraction procedure. These values are based on extraction procedures used for soils west of the Cascade Range (Marx et al., 1999) |
||
Some nutrients are antagonistic with others, that is, their presence in high concentration results in poor absorption of other nutrients. For example, iron and manganese compete for absorption sites, and they may interfere with one another as a cofactor in oxidation-reduction reactions. High concentrations of manganese may manifest itself in the plant as iron deficiency, even if iron is in sufficient quantity in the soil. There are many examples of nutrient antagonism, most of which are a result of competition for absorption and translocation.
Some nutrients are synergistic with others; that is, the presence of one nutrient causes increased uptake of another. Synergistic absorption can be a result of biological factors. For example, calcium is believed to increase phosphorus uptake because it stimulates the transport of phosphorus along mitochondrial membranes. Often, synergistic absorption is a result of one nutrient’s effect on rhizosphere pH (the rhizosphere is the soil immediately surrounding the root system). For example, ammonium increases phosphorus uptake in alkaline soils due to its acidifying effect in soil.
Methods of Nutritional Diagnosis
Although useful when confronted with unknown plant problems, visually diagnosing nutrient deficiencies is often inaccurate. If you suspect a nutritional problem, there are two methods for determining the nutritional status of crops. You should conduct a soil test and/or analyze the nutrient concentration of leaf tissue.
Soil tests should be conducted prior to fertilizing field crops. Apply only those nutrients that are indicated by the soil test to be low. For Oregon soils, the best reference currently available is the Oregon State University Extension publication titled “Soil Test Interpretation Guide”. Soil tests detail the concentration of most nutrients in the soil, and sometimes this may be good enough to diagnose a problem. However, soil tests will not specifically identify a deficiency within the plant. Only a foliar tissue test can provide this information.
Foliar tissue analyses indicate the current nutrient status within a plant, which nutrients have been adequately absorbed, and perhaps more importantly, which ones have not been absorbed. Sufficiency ranges for each nutrient vary among plant species. The most comprehensive resource for sufficiency ranges in tissue analysis can be found in the book titled “Plant Analysis Handbook II” (Mills and Jones, 1996). Foliar tissue analyses will determine whether a nutrient is deficient in the plant; however, it will not determine why that nutrient is deficient. For example, low iron concentration in foliar tissue may be the result of low iron levels in the soil or high pH (another piece of information determined by a soil test not indicated by a foliar tissue analysis).
Some nutritional deficiencies may be due to interruptions in the vascular system of the plant. This may occur due to root rotting organisms, cankers or mechanical wounds to woody plants. A careful examination of the plant is necessary to rule out these types of problems.
To prevent a nutrient deficiency, use a soil test to guide your fertilizer program. If a deficiency does occur, conduct both a leaf tissue analysis and a soil analysis to accurately diagnose the problem.
Determining Nutritional Status of Container Crops
Plants grown in container nurseries are also affected by nutritional disorders. Nutritional status of these crops can also be monitored with foliar analyses as they are in field crops; however, soil tests are conducted differently. Soil test methods described above were developed for field soils. Field soils are also called mineral soils because they are made from fine particles of eroded mineral rocks. Container crops use soil-less media (media without mineral soil) composed primarily of organic components such as bark, peat, and compost.
In containers, the most common method used to monitor substrate pH and nutritional levels is to analyze the water leached from the bottom of the container. This method is commonly called a “pour-through” method. Substrate pH and electrical conductivity (EC) are the parameters most commonly measured. EC provides a gauge of overall salt (fertilizer) levels in the container. Since agricultural fertilizers are applied as salts, EC can provide an indication of the fertilizer level. This can be useful for determining when substrate nutrient levels are sufficiently low to warrant additional fertilizer applications.
The procedure to measure pH and EC is easy, the equipment is affordable, and it should be performed at least monthly; thus container growers should learn this method and conduct their own analyses. More detailed analysis of individual mineral nutrients should be performed by a laboratory. In that case, water samples should be collected with the same method and frozen until delivered to the lab.
The Pour-through method
Below are step-by-step instructions on how to collect substrate solution for measuring pH and EC: Consistency is absolutely the most critical component of this procedure. The time that lapses between saturating the containers and conducting the pour-through must be the same every time. Sampling should also occur at roughly the same time each day and preferably in the morning.
- Irrigate plants thoroughly, and then wait 1 to 2 hours (being consistent each time). Waiting will allow containers to drain and for the container solution to come into equilibrium with container salts. While waiting, calibrate your pH and EC meters so they are ready to use.
- One to two hours after irrigation has finished, elevate the container above a clean and dry saucer. Be careful not to tilt the container, always hold it straight and upright.
- For a one-gallon container, pour approximately 100 ml (3 oz.) of distilled water evenly over the container surface. The goal is to apply to the container surface so that substrate solution is forced out of the container bottom.
- Wait 15 minutes for water to leach from drainage holes at the bottom of the container.
- Pour water from saucer into a clean container or jar and measure pH and EC. pH should be measured immediately after the sample is collected (within 30 minutes). EC can be measured at a later time.
- If samples are to be sent to a laboratory for more detailed analysis, freeze immediately after collection and store frozen until they are sent to the lab. Accurately determining levels of other mineral elements, especially nitrogen, can be affected if the solution is not frozen soon after collection.
This procedure should be performed on several random samples from throughout the container yard. Randomly sample different containers each time you perform the procedure. Do not use the same containers repeatedly.
For large containers, irrigate and wait one hour, then tilt the container on its side and collect the water as it seeps from the drainage holes. The pH of that water is comparable to that which is collected from a traditional pour-through.
EC and pH should be measured at least monthly. Record results to track changes in pH over time. Results will vary when measured by different individuals and by using different pH meters, so try to assign the task to a single individual and use the same equipment in the same way.
Further Reading
Bryson, G. M., and Mills, H. A. 2015. Plant Analysis Handbook IV. Athens, GA: .MicroMacro Publishing, Inc.
Horneck, D. A., Sullivan, D, M., Owen, J., and Hart, J. M. 2011. Soil test interpretation guide. Oregon State University Extension Publication, EC 1478.
Whitcomb, C.E. 2001. Production of Landscape Plants II. Stillwater, OK: Lacebark, Inc..


